
Price Elasticity: Finding the Perfect Price for Maximum Supplement Profit
· 18 min read · By Rocktomic Labs Team

Supplement Price Elasticity: Maximize Gross Profit
Most supplement brands pick a price by copying a competitor or adding a margin to cost. Price elasticity replaces that guesswork with a testable number: the percent of sales you lose for every percent you raise the price. This guide explains the formula, runs a real money-math example on a white-label SKU, and gives a repeatable test plan to find the exact price that maximizes gross profit, not just revenue. No inventory is required to run the tests, so the process costs almost nothing to start.

By the end of this guide you will have three things: the elasticity formula you can compute in minutes, the demand drivers that tell you whether your brand is elastic or inelastic, and a test playbook you can run on a live store with zero inventory and a $0/month entry point.
What Is Price Elasticity of Demand?
Price elasticity of demand measures how responsive unit sales are to a price change. It is the percentage change in quantity sold divided by the percentage change in price. Elastic demand (above 1) means buyers shop on price. Inelastic demand (below 1) means buyers keep buying even after an increase. For supplements, the number changes by SKU, audience, and brand trust, so it must be measured, not assumed.
Pick any product, set your monthly volume, and see your real per-unit and monthly profit on every plan – fulfillment, card processing, and membership all included.
The ratio is not a universal constant. It shifts with the product, the buyer, and the buying context. A staple multivitamin bought on autoship behaves differently from a seasonal detox SKU, and the same product can move from elastic to inelastic as a brand builds trust. That’s why the number has to be measured for each SKU rather than borrowed from a category average.
This is a foundational concept in microeconomics, documented by Investopedia (updated February 17, 2026).
The Price Elasticity Formula, Step by Step
Elasticity is a percentage change divided by another percentage change. It answers one question: when price moves, how much does quantity sold move with it? If volume barely moves, demand is inelastic. If it swings hard, demand is elastic. The ratio tells you which camp you are in.
Price elasticity of demand = % change in quantity sold / % change in price
Work it with a generic example. Say a price rises from $35 to $40. That is a 14% increase. Monthly units fall from 300 to 250, a 17% drop. Divide 17 by 14 and you get about 1.2. Demand is elastic at this point. Keep the example illustrative: it is not tied to any Rocktomic SKU.
One test gives you one point. Run the same change from the other direction and the percentages shift because the base changes. The midpoint method fixes that. Average the two prices and the two quantities before computing percentages. The elasticity between any two points then reads the same in either direction.
Three regimes decide your pricing move. Below 1 is inelastic: a price increase raises revenue because volume barely moves. Above 1 is elastic: a price increase lowers revenue because volume falls faster than price rises. Exactly 1 is unitary: revenue stays flat.
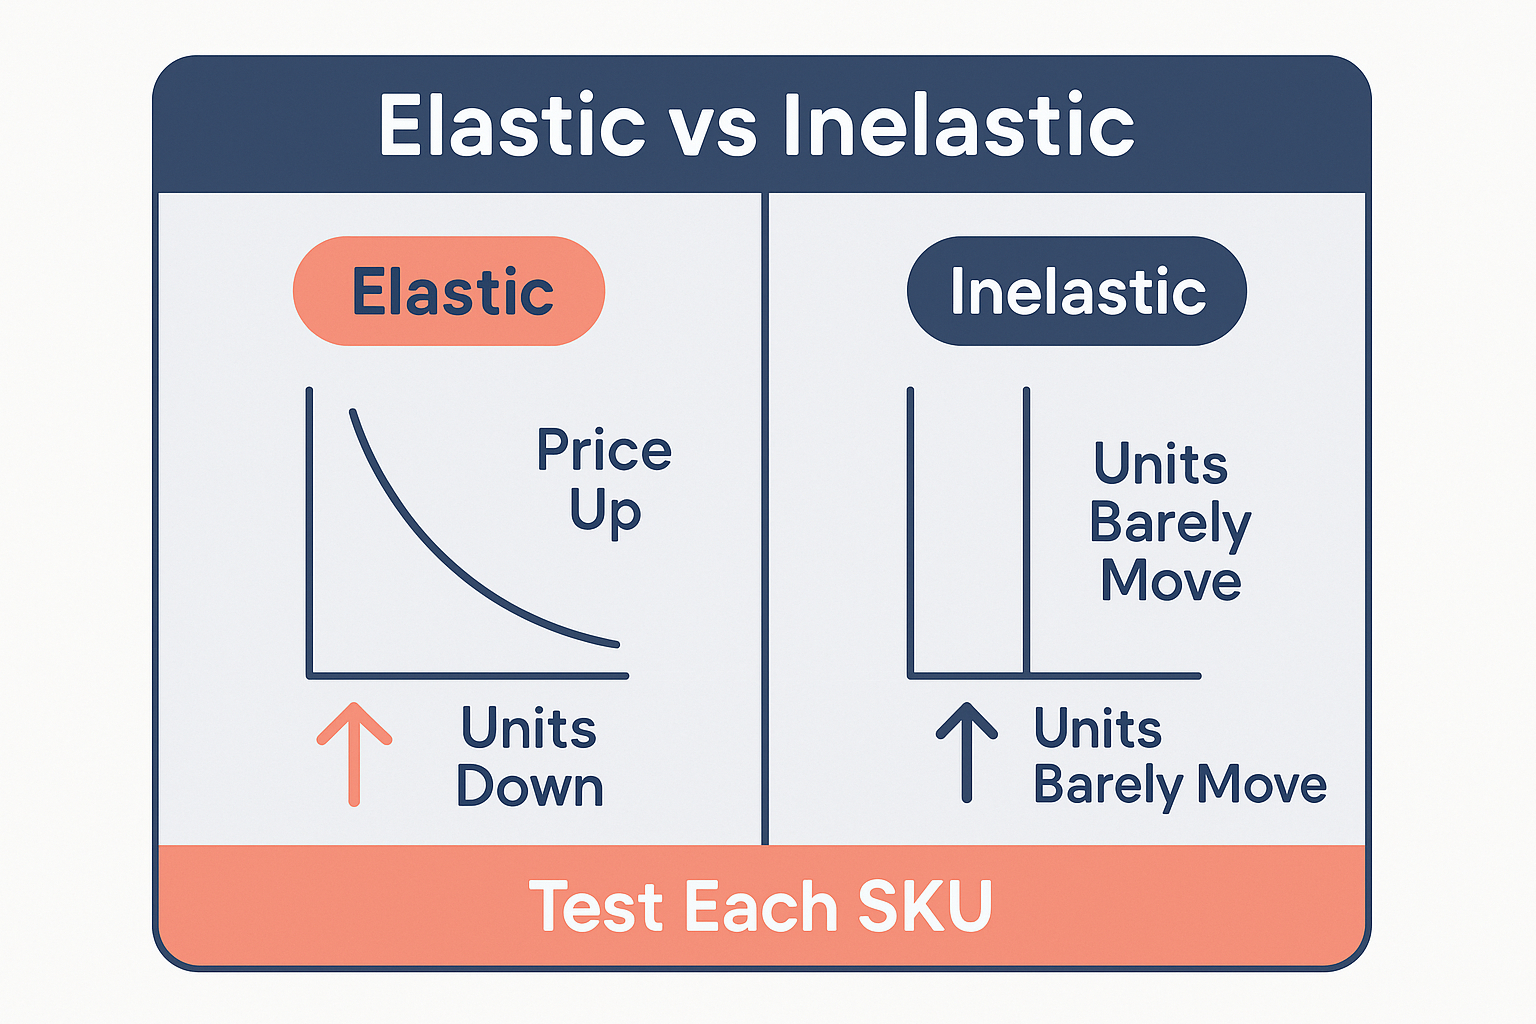
Elasticity is direction-specific. A test moving upward from a baseline gives a different number than a test moving downward. Customers react one way to a $5 hike and another way to a $5 cut. Measure both directions before you commit to a price.
Once the number tells you how responsive your buyers are, the next question is how that price looks on the page. The psychology of charm pricing vs round numbers starts working before a customer ever does the math.
What Makes Supplement Demand Elastic or Inelastic?
Price elasticity is buyer psychology with a number attached. Price changes do not move every customer the same way, and they never should. Five forces decide whether your buyers bolt for the cheapest option or stay with your brand at a higher price.
- Number of close substitutes. Supplements are a substitute-heavy category. A shopper who sees ten identical-looking protein powders on a marketplace shelf faces elastic demand. One search, one tap, and they own the cheaper bottle.
- Brand loyalty and audience trust. This is the biggest lever for a creator brand. The St. Louis Fed (June 25, 2024) frames it simply: brand strength flattens the demand curve. Loyal buyers do not cross-shop like strangers; they trust your word over a label comparison.
- Share of income. A $40 bottle of greens is a tiny fraction of most household budgets. When a purchase barely dents income, buyers barely feel a price move, so demand stays inelastic.
- Habit and repeat purchase. Supplements run on routine. Once a scoop or a gummy is part of the morning stack, reordering is automatic, and habit buyers skip the price comparison. First-time buyers are the most price sensitive people you will sell to, so the first order is where your price story matters most.
- Time to compare. Fast decisions mean inelastic demand. A viewer who buys from a social post acts on impulse, not research. Give that same buyer a week-long shopping window and they will find three cheaper alternatives.
What this means for your brand
Here is where a creator brand built on Rocktomic earns its position. A loyal following, third-party tested quality with a COA on every batch, and a consistent brand identity move you off that flat commodity curve. The unbranded bottle on the marketplace shelf loses the sale on any small price increase. Your line holds because buyers have a reason to stay, and that reason is the license to charge more. The mechanical side of that raise is in the premium pricing playbook for white label supplements.
Why Most Supplement Brands Price Wrong
Most supplement brands get pricing wrong for the same three reasons, and none of them have anything to do with demand. Each one ignores the brand’s own cost base and treats price as a guess instead of a business decision.
Failure 1: Pricing to competitor shelf prices
Copying a rival’s price ignores your cost base and your audience’s willingness to pay. You don’t know their margins, their volume, or their buyers. Matching their price means you’re using their business decisions to set yours, and they made those decisions for themselves, not for you.
Failure 2: Pricing to cost-plus
Cost-plus means taking your product cost, adding one fixed margin, and calling it the price. That treats every order the same. It ignores elasticity, which is the simple fact that some buyers will pay more and others will buy more at a lower price. A single fixed margin can’t capture both.
Failure 3: Discounting to buy volume
Every discount runs through your fixed landed cost. Drop the price by three dollars, and that three dollars comes straight out of gross profit per unit while your cost per unit hasn’t moved at all. A lower price only raises gross profit if the extra volume more than pays for the cut, and often it doesn’t.
Some platforms push pallet buys and per-order fee structures, which forces volume thinking. Buy in bulk, need to move it, so you discount. Rocktomic’s on-demand model removes that pressure entirely: you sell first, we manufacture and ship after, so there’s no inventory sitting around that needs to be discounted. That’s the whole point of a zero-inventory model.
The market context matters here. The supplements category is large and still growing, and Grand View Research tracks the growth in its dietary supplements market report. The demand is real. The question is whether your pricing captures it, and none of the three failures above will get you there.
Before you run your next sale, read how discount codes destroy supplement margins. It walks through what a coupon actually does to your gross profit per order.
Money Math: Find the Profit-Maximizing Price
Run the math on one SKU before you touch a single label. Use Best Sellers Blend (ROC105) as the test case. Wholesale on the Scale plan ($297/month) runs $5.67 per unit. Add the flat $2 per item fulfillment fee and landed cost comes to $7.67. Baseline MSRP sits at $35.97. Unit gross profit is simple: test price minus $7.67.
Every volume figure in the ladder below is a model input, not sales data. The only real cost inputs are the $5.67 wholesale price and the $2 per item fulfillment fee. Punch your own volume assumptions into the supplement margin calculator and watch the outcome shift.
| Test Price | Units Sold per Month (model) | Revenue | Unit Gross Profit (price minus $7.67) | Total Gross Profit | Implied Elasticity vs Baseline |
|---|---|---|---|---|---|
| $29.97 | 380 | $11,388.60 | $22.30 | $8,474.00 | 1.60 |
| $35.97 | 300 | $10,791.00 | $28.30 | $8,490.00 | baseline |
| $39.97 | 270 | $10,791.90 | $32.30 | $8,721.00 | 0.90 |
| $45.97 | 200 | $9,194.00 | $38.30 | $7,660.00 | 1.20 |
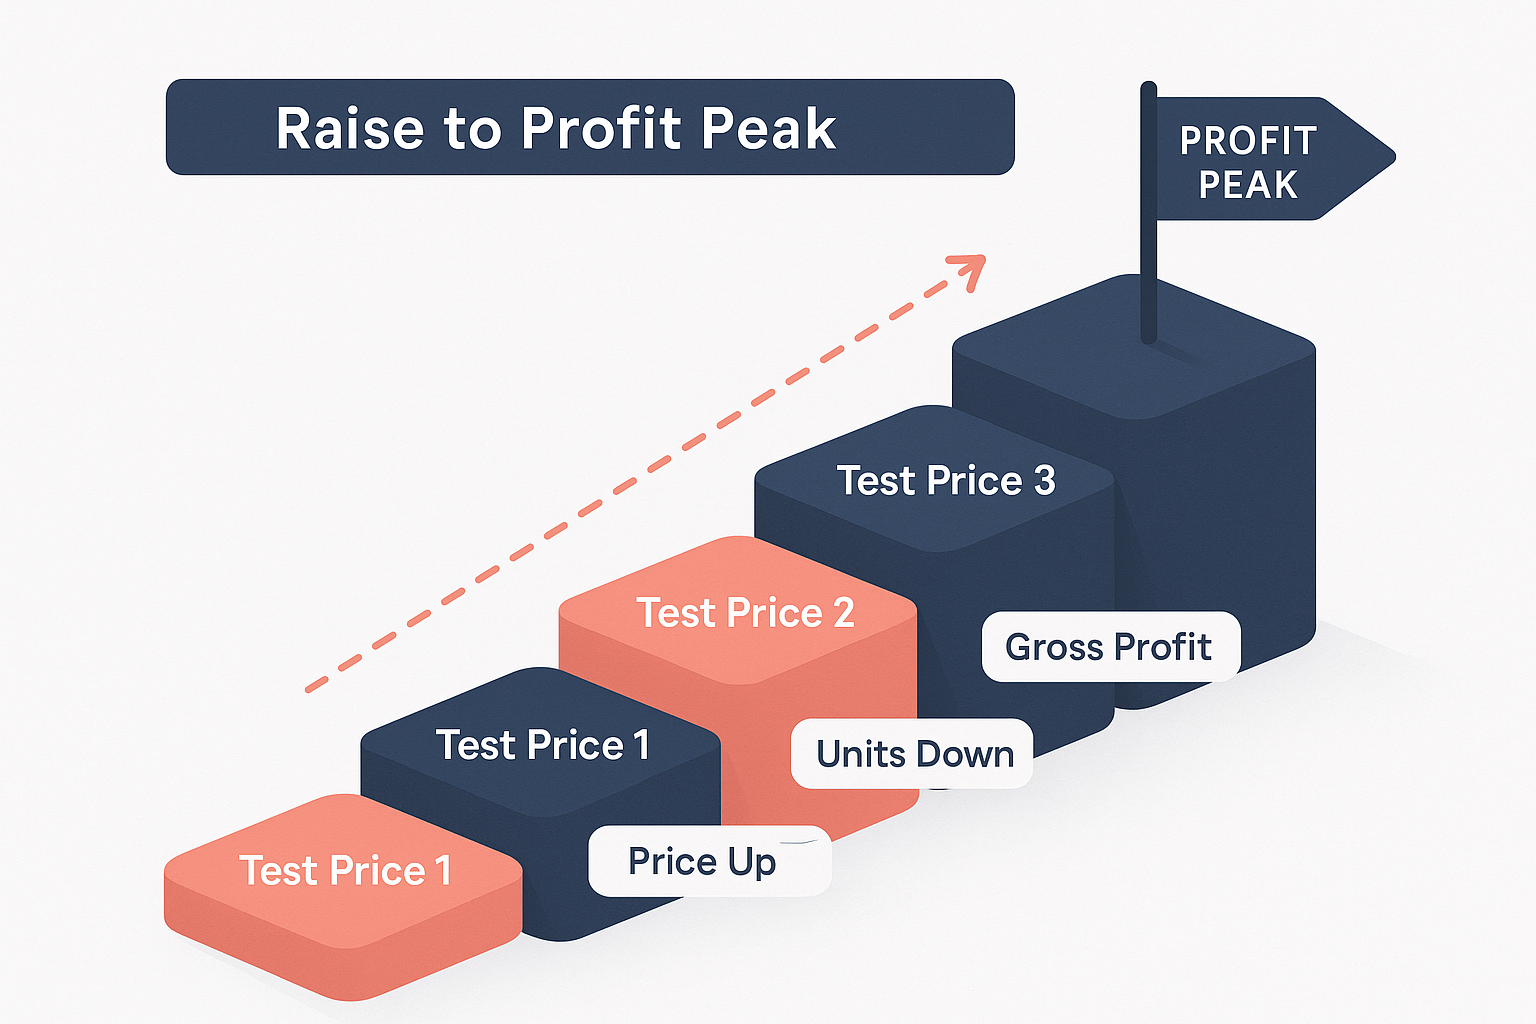
Read the ladder top to bottom. At $29.97, the model shows 380 units sold and $8,474 in gross profit. At the $35.97 baseline, 300 units produce $8,490. At $45.97, 200 units leave you with $7,660.
The winner is the $39.97 test. It beats the baseline MSRP by $231 per month, or $2,772 per year, even though revenue is nearly flat. Baseline revenue: $10,791. Test revenue: $10,791.90. A $0.90 swing in revenue, a $231 swing in profit. Unit gross profit climbs from $28.30 to $32.30, and that $4 gain across 270 units outruns the 30 units you give up at the lower price.
Gross profit is the decision metric. Not revenue. Not conversion rate. A price that pulls in more dollars can still leave you with less money at the end of the month. Revenue only pays you after it clears your landed cost.
The implied elasticity column shows how much volume responds to each price move. The $39.97 test sits at 0.90, below the baseline. Volume loss is proportionally smaller than the price gain. The $45.97 price, at 1.20, crosses into territory where volume falls faster than price rises.
Test prices against your real costs, not against what feels right. Keep the flat $2 per item fulfillment fee in the model and the math stays honest at every volume level. The price that maximizes profit is the price you can defend.
How to Test Prices Without Buying Inventory
Price testing only hurts when you own the stock you priced wrong. Rocktomic’s zero-inventory model removes that risk. You move a number, watch units move, and change it back within days. No pallet of mispriced product sitting in your garage.
Run one of three test formats
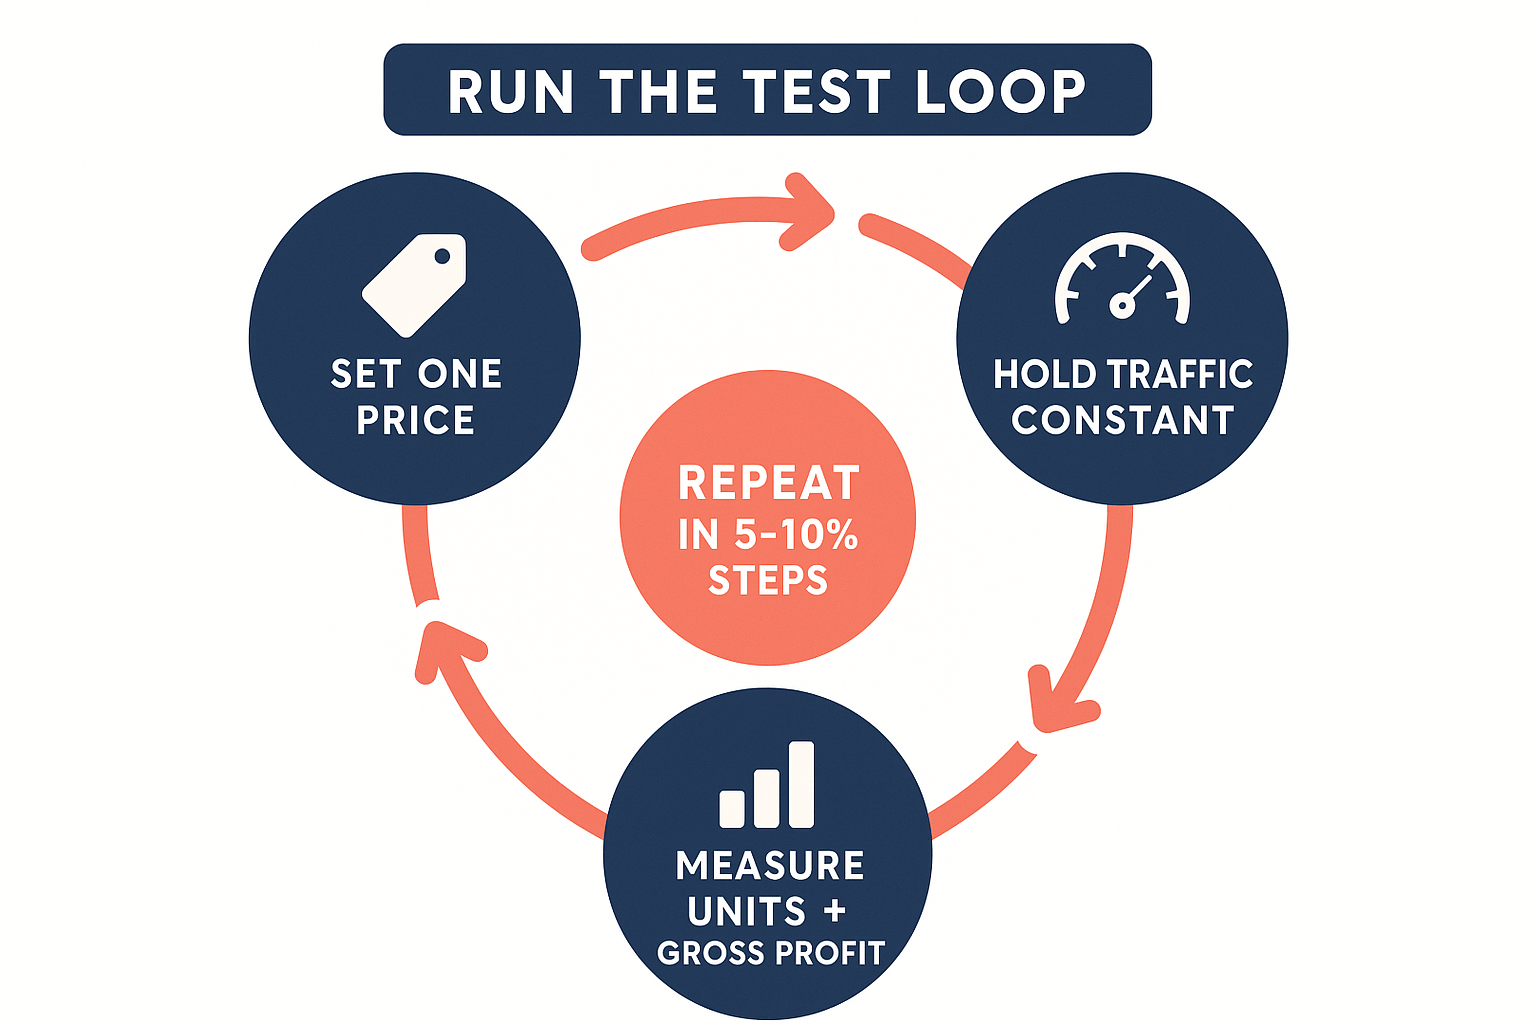
Start with an A/B test: split your traffic between two price points and compare results. A pre/post test holds one price steady for two weeks, changes it, then holds the new price for two more weeks. Run a 3-point price ladder: test your current price, one tier above it, and one tier below it. Make the price gap big enough to register in the data, not so big that the test stops being realistic.
Run any format for at least two weeks. That gives weekday and weekend buying patterns time to wash out of the data.
Control the test, measure the right number
A price test is only as clean as its controls. Keep traffic, ads, and seasonality constant, and keep ad creative price-agnostic so ad spend does not skew the outcome. Change one variable at a time, or you will not know which change moved the number. Log anything else that shifts during the window; if something external moved, read around it instead of trusting the blended number.
Shopify’s May 28, 2025 guide on split testing pricing is the practical playbook: isolate the price, give the test time, and read the outcome against a fixed baseline.
Read the outcome on gross profit per order, not conversion rate. Conversion rate tells you what shoppers did; gross profit per order tells you whether that behavior made you money. The two can move in opposite directions, and only one pays your bills. Part 6’s model math defines that decision metric; this is where you feed it real volume data.
Why zero inventory makes testing free
Because Rocktomic products are made, labeled, and shipped on demand with no upfront purchase, a creator can test a price, watch the units, and revert without liquidating stock. A traditional brand buys deep, prices, and prays; when the price is wrong, the error is locked in inventory. On demand, the error is locked in a spreadsheet cell you can edit tomorrow. A bad price costs you a couple of weeks of data, not a warehouse of unsold bottles; see how on-demand fulfillment works for the full loop.
When to Raise Prices and When to Hold
Your elasticity number tells you which move to make. Measured elasticity below 1 means demand is inelastic, so a price increase raises revenue and usually gross profit. Raise the price. Then hold it long enough to re-measure, because the new sales pace will confirm whether you overshot.
Measured elasticity above 1 means demand is elastic. Your first instinct will be to cut the price to win back volume. Don’t. A price cut runs through the fixed landed cost logic from Part 6, so the discount eats contribution before the first unit sells. Test bundles or value adds first. Hold the price while you measure the new offer’s effect on average order value.
Holding is an active decision, not a default. It means keeping price steady while you change the offer, the packaging, or the bundle mix, then checking whether demand responds. If revenue holds or climbs at the same price, you’ve found your spot.
That’s the whole rule: raise when inelastic, hold and add value when elastic.
Signals that elasticity is shifting
Elasticity isn’t a permanent number. Re-measure when you see any of these:
- New competitors entering your category, which usually pushes demand toward elastic.
- Rising ad costs that shrink what you can spend to win a price-sensitive buyer.
- A commoditized category, where shoppers compare on price because they can’t tell brands apart.
- A stronger relationship with your audience, which moves demand toward inelastic.
The last signal matters most for creators. The tighter your connection with followers, the more pricing power you hold. Trust is what makes a customer choose your label over a cheaper bottle on the shelf.
Premium positioning lives on the inelastic side of the curve. High-ticket SKUs and trusted brands lose less volume when price goes up, which is why pricing premium supplements for elite margins pays off. Measure, act, re-measure.
Tiered Pricing and the Psychology of the Perfect Price
One flat price forces every buyer to accept the same deal, and it leaves money on the table. Some customers want the cheapest entry point. Others want the biggest bundle. A few will pay for the premium option without blinking. A single price can only capture one of those groups. Everyone else either overpays or walks. Tiered pricing is how you stop leaving that money behind.
Good-better-best tiers fix that. You list three versions of the same offer: a starter product, a core product, and a premium version or bundle. Each tier targets a different willingness-to-pay segment. The budget buyer self-selects the low tier. The value hunter goes for the bundle. The high-intent buyer picks the top tier. Nobody is forced into a price they are not comfortable with, and you capture demand across the whole curve instead of one point on it.
Each Tier Carries Its Own Demand Curve
Tiering is a low-risk elasticity test for that exact reason. Each tier carries its own demand curve, so moving one tier does not reset the whole store. Raise the premium price and watch only that tier’s volume react. If it holds, you found extra margin. If it drops, the entry and mid tiers keep converting while you adjust. You never gamble the entire catalog on one price change.
Bundles do double duty here. They raise average order value while giving price-sensitive buyers a reason to spend more: more product per dollar, framed as a deal. That framing matters as much as the math. Charm pricing, the $29.99-versus-$30 effect covered in Part 3, shapes perception the same way. Round numbers feel premium; charm prices feel like a bargain. Put round numbers on the top tier to signal quality, charm prices on the entry tier to signal value.
For a full breakdown of how to structure tiers for a supplement store, see the good-better-best tiered pricing models guide.
Keep Tests Cheap: Free Entry and Scale Pricing
Price testing only works if you can run it repeatedly without burning cash. The Rocktomic cost structure keeps that cheap.
The Free plan is $0 per month. You pay a flat fulfillment fee per item, charged when an order ships. No monthly bill. No inventory purchased upfront. If a test price flops, you are out a few dollars in fulfillment fees, not a warehouse of unsold bottles.
The Scale plan is $297 per month. It adds the lowest per-unit wholesale pricing across the full catalog. That lower cost per unit widens the margin in every price test, which means even a modest price holds up better on the profit side.
Those are the only two plans. Free or Scale. Both share the same on-demand model: product is made, labeled, and shipped only after a customer orders. So the cost of testing is tied to actual sales, not to inventory you hope to move.
Run a test. Read the numbers. Adjust. Run another. That loop stays affordable because you never front money for stock. The pricing structure exists to make iteration cheap, and iteration is what finds your profit-maximizing price.
Supplement Price Elasticity: FAQ
What is price elasticity of demand?
Investopedia, updated February 17, 2026, defines price elasticity of demand as a measure of how much the quantity demanded of a product changes when its price changes. It is the percentage change in quantity demanded divided by the percentage change in price. Above 1 means elastic demand, where buyers are price-sensitive. Below 1 means inelastic demand, where buyers keep buying. For a supplement brand, that number shows whether a price move adds or costs revenue.
How do you calculate the price elasticity of demand?
Divide the percentage change in quantity demanded by the percentage change in price. Example: a supplement at $35 sells 300 units. The price rises to $40 and sales fall to 250. Quantity drops about 17 percent, price rises about 14 percent, giving elasticity of about 1.2. The midpoint method is the standard alternative: it averages starting and ending values so the result is identical in either direction.
What does an elasticity above or below 1 mean for revenue?
An elasticity above 1 means demand is elastic: a price cut raises total revenue and a price increase lowers it. Below 1, demand is inelastic: a price increase raises revenue and a price cut lowers it. At exactly 1, revenue stays flat. But total revenue is the wrong target. Gross profit is. A price cut that grows revenue can still shrink profit when extra units carry fulfillment costs. Model gross profit at each candidate price before committing.
How do you test price elasticity for a supplement brand?
Test one variable at a time, per Shopify’s guidance of May 28, 2025. For a supplement brand, move price by 5 to 10 percent in a single step and hold it two weeks. Track units sold, conversion rate, and revenue per session before, during, and after. A 2 percent nudge disappears in daily sales noise; a 5 to 10 percent move is large enough to read and small enough to avoid training customers to wait for discounts.
Why is supplement demand often inelastic for strong brands?
Demand is stickier when a product has few close substitutes and buyers trust it, as the St. Louis Fed noted on June 25, 2024. Customers who believe a formula works do not switch over a dollar. Rocktomic backs that trust with a Certificate of Analysis on every batch, so a brand points to documented quality instead of competing on price. Fewer substitutes plus proof equals demand that holds at a higher price.
What does it cost to start testing supplement prices with Rocktomic?
Price testing starts on the Free plan at $0 per month. The only payment is the flat fulfillment fee per item when an order ships, so a test with zero orders costs nothing. The Scale plan, $297 per month, adds the lowest per-unit wholesale pricing and the full catalog. When a winner emerges, bulk orders are available for deeper per-unit cost. No inventory was bought upfront, so the only money at risk is the fulfillment fee on units that sell.
What price maximizes gross profit on a white-label supplement?
Best Sellers Blend (ROC105) is a working example. On the Scale plan, wholesale is $5.67 per unit. Add the flat $2 per item fulfillment fee and landed cost is $7.67. The price that maximizes gross profit comes from modeling units sold at several price points. A higher price with slightly fewer units often beats a lower price with more units. The winning price is not always the lowest. Model the demand curve, then set price at the peak.
Can a creator raise supplement prices without losing customers?
Yes, when the increase is modest and the brand has proof. A 5 to 10 percent price increase is the range most likely to hold volume. No inventory was purchased upfront, so the Scale plan’s $297 monthly fee is the only fixed cost to manage; everything else scales with units sold. Units and gross profit should be watched for two weeks before any adjustment. If volume dips, margin per unit rises, and the test still paid for itself.
Ready to Test Prices on a Real SKU?
Ready to test prices on a real SKU? Compare Rocktomic membership plans, run your own scenarios in the supplement margin calculator, or book a call to map out your first price test. Zero inventory means the only cost of experimenting is the flat fulfillment fee per item when an order ships. Start free at $0/month, or run on Scale for $297/month and get the lowest per-unit wholesale pricing.
Last updated: June 21, 2026.