
The 3:1 Rule: Mastering the LTV to CAC Ratio for Supplements
· 18 min read · By Rocktomic Labs Team

The 3:1 Rule: Mastering the LTV to CAC Ratio for Supplements
If your LTV to CAC ratio sits below 3:1, scaling only accelerates losses. The 3:1 rule means every customer must return three dollars of lifetime value for every dollar spent acquiring them, and it is the floor for sustainable ecommerce (Shopify (Jan 2026)). This guide shows how to measure lifetime value against acquisition costs, what your margin math can support, and the levers that move the number.
Pick any product, set your monthly volume, and see your real per-unit and monthly profit on every plan – fulfillment, card processing, and membership all included.

What Is the LTV to CAC Ratio?
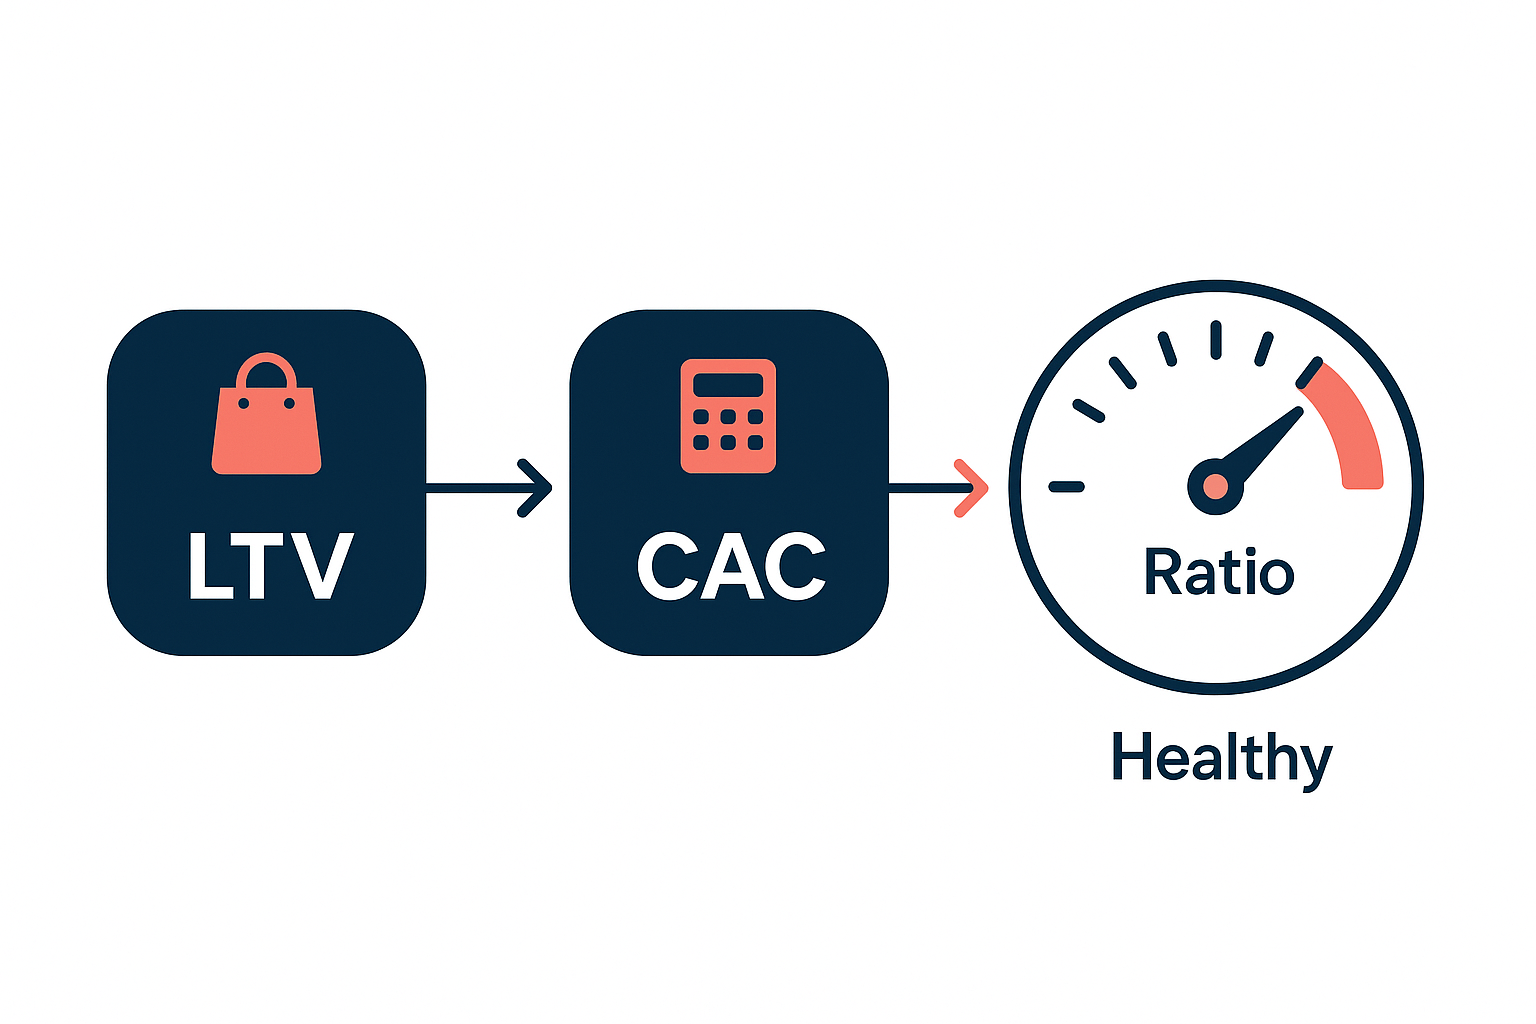
The LTV to CAC ratio compares how much a customer is worth over their entire relationship with a brand (LTV) against how much it costs to acquire that customer (CAC). Operators divide LTV by CAC to judge whether growth is profitable. A 3:1 ratio means each customer returns three dollars of lifetime value for every dollar of acquisition spend. It is the core health check for scaling ecommerce.
LTV is the profit a customer produces over their buying lifetime. CAC is everything you spend to win them.
Why Is the 3:1 Ratio the Golden Rule of Supplement Ecommerce?
The 3:1 floor is the number every operator quotes because it covers the costs the ad platforms never show. Meta and TikTok report a cost per purchase. They do not report refunds, chargebacks, the fulfillment fee, or the retargeting spend that runs for weeks before a second order lands. A campaign can look profitable at the platform level and still lose money once those costs hit. The ratio forces you to count all of it.
Shopify (Jan 26, 2026) treats 3:1 as the minimum for ecommerce, with 3:1 to 4:1 typical for a healthy store. Eightx (July 1, 2026) lands on the same floor and pushes further: 4:1 and higher is preferred when you’re scaling paid channels, not just holding steady. Ringly (June 3, 2026) draws the hard line below it – anything under 2:1 is unsustainable. Three sources, one floor. That consistency is why the industry treats the ratio as a rule, not a suggestion.
| Ratio band | What it means for your brand |
|---|---|
| Under 2:1 | Unsustainable – fix margins or retention first |
| 2:1 to 3:1 | Below the floor – cut CAC waste and lift reorders |
| 3:1 | Minimum healthy benchmark |
| 3:1 to 5:1 | Healthy – 4:1 ideal for scaling |
| Above 5:1 | Under-investing in growth – spend more on proven channels |
Most supplement brands sit between 2:1 and 3:1 in the first 90 days because CAC is front-loaded and LTV is still compounding. New customers cost the most on day one; every reorder after that carries no new acquisition cost. That is not the signal to cut spend. It is the signal to tighten the variables you control: offer, retention, and the cost of acquiring the next customer.
Supplements are structurally suited to beat the floor because they are a consumable product with a natural reorder cycle. A protein powder or greens blend gets used up, so the customer comes back. That repeat purchase builds LTV without a new acquisition cost, which is why Commerce Catalyst (May 25, 2026) benchmarks the category on replenishment behavior. Add a subscription and the ratio climbs on the retention side while CAC stays flat. The longer a customer stays, the better the math gets.
How Do You Calculate LTV for a Supplement Brand?
LTV = average order value x purchases per year x customer lifespan in years x contribution margin percent. Four variables, and the fourth one is where most supplement brands go wrong.
The first three are easy to pull from store data. Purchases per year and lifespan both come straight from your order history. The fourth forces you to admit what each order actually costs you. Skip it and your LTV is fiction.
Run the formula in dollars and it simplifies further: contribution per order x total purchases. Contribution is revenue minus cost of goods, fulfillment, and transaction fees. That is the money you keep, and it is the only honest numerator for lifetime value.
Revenue-based LTV overstates value by 1.5x to 3x
Revenue-based LTV multiplies the full order value across the customer’s buying life and treats that total as the customer’s worth. It counts every dollar of sales as profit. With supplement margins, the revenue version overstates real value by 1.5x to 3x.
That overstatement is dangerous because CAC decisions run off it. If LTV is inflated, your breakeven ad cost is inflated too. You scale, and the cash leak shows up a few months later. Contribution keeps the math honest.
ROC943, worked
Take ROC943, a Rocktomic SKU. Average order value: $29.97. Contribution per order, after cost of goods, fulfillment, and transaction fees: $19.52. A typical customer buys 3 times.
Contribution LTV = $19.52 x 3 = $58.56.
| Input | Value |
|---|---|
| Average order value | $29.97 |
| Purchases per customer | 3 |
| Contribution per order | $19.52 |
| Contribution LTV | $58.56 |
$58.56 is the ceiling for what you can spend to acquire that customer. Stay under it and every order contributes. Blow past it and ad spend quietly erases margin.
Cohort LTV shows whether retention is improving or degrading
Blended LTV averages every customer together, which hides the trend. A customer acquired in January and one acquired in March get merged into one number even when their repeat behavior is completely different. You cannot see improvement or decay in a blend.
Cohort LTV fixes that. Group customers by the month they were acquired and track each group on its own: what did the March cohort spend in month one, month two, month three? Newer cohorts tell you if retention is getting better or worse before blended numbers catch up.
If your last three cohorts show rising repeat purchase rates, retention is healthy and you can push CAC higher. If the trend is down, more ad spend makes it worse. Fix the product experience first, then reinvest.
Then run your own numbers with the ultimate LTV calculator for supplement brands and see where your real CAC ceiling sits.
How Do You Calculate CAC for a Supplement Brand?
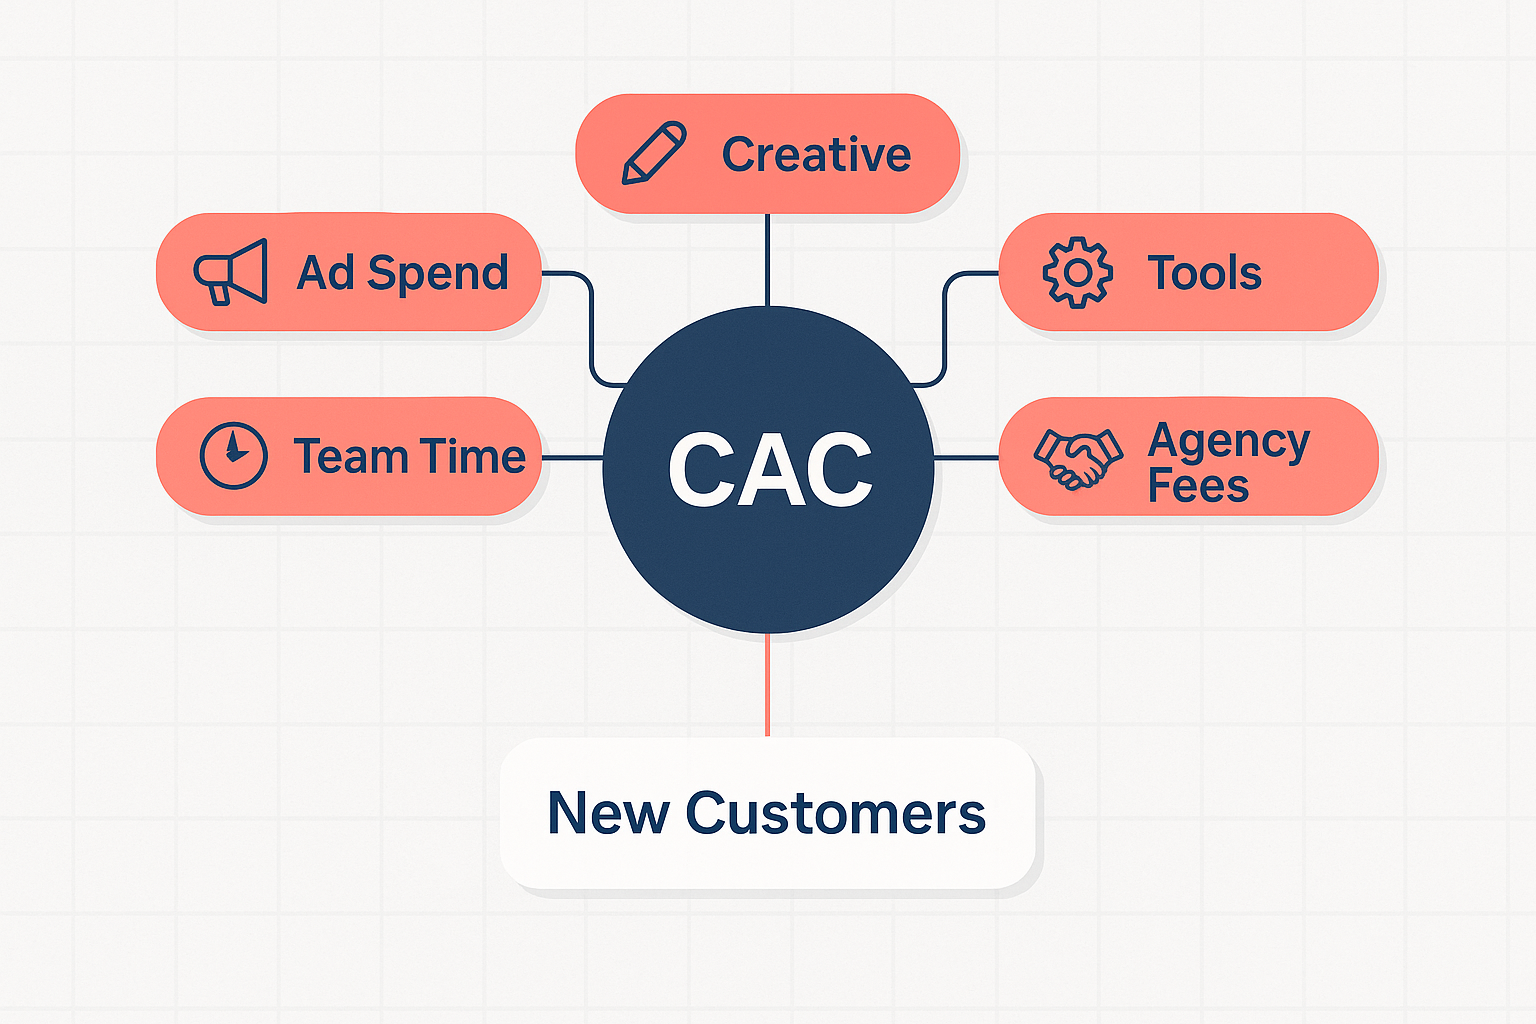
CAC is one division. CAC = total acquisition spend / new customers acquired in the same period. Spend $12,000 in March, bring in 150 first-time buyers, and your CAC is $80 per customer.
Match the two sides of that equation. Count only customers who paid for the first time in that window, and use the spend from that same window. Mixing a February customer count with March spend gives you noise, not a number you can scale against.
Use the fully-loaded number, not the platform number
Ad platforms only show what you spent with them. They don’t show the rest of the machine. A fully-loaded CAC includes ad spend, creative production, agency fees, software tools, and the share of your team’s time spent on acquisition.
Add those up and the platform number can under-report your real cost by 30% to 50%. Here is the full picture on the March example.
| Input | Amount |
|---|---|
| Ad platform spend | $12,000 |
| Creative production, agency fees, software | $4,000 |
| Share of team time | $2,000 |
| Total acquisition spend | $18,000 |
| New customers acquired | 150 |
| Platform CAC | $80 |
| Fully-loaded CAC | $120 |
That $40 gap isn’t a rounding error. It is the difference between a channel that looks profitable and one that is not.
Blended CAC versus channel CAC
Blended CAC lumps every dollar of spend against every new customer. It is one number, easy to track, and it hides your worst channels inside your best ones.
Channel CAC isolates one source. TikTok gets its own spend and its own customers. Meta gets the same. When the blended number looks healthy but profit is flat, channel-level CAC is where the problem surfaces. Run both every month.
Where supplement CAC lands
Supplement DTC CAC runs about $89 per customer, per Ringly (June 3, 2026). The same source puts retention costs at 5 to 7 times less than acquisition: Ringly (June 3, 2026).
That gap is the whole argument for a subscription or replenishment model. Acquisition is the expensive part. Keeping the customer is cheap by comparison, and that gap is what makes a healthy 3:1 LTV to CAC ratio achievable in the first place.
If your fully-loaded CAC runs above the benchmark, the fix is rarely more spend. It is usually one of the hidden costs that eat supplement margins: duplicate orders, refunds, shipping overages, or a fulfillment partner charging per-order fees. Each one silently inflates the top of the CAC equation.
Money Math: What CAC Can Your Supplement Brand Afford at 3:1?
Here is where the ratio stops being theory. Take a real product from the Rocktomic catalog: ROC943, a 60-count supplement sold at an MSRP of $29.97. On the Scale plan, wholesale cost runs $8.45 per unit, leaving a $21.52 unit margin, which works out to 71.8% of the price. Until you know those three numbers, CAC is a guess.
Then subtract fulfillment. Rocktomic’s flat $2 per item on-demand fulfillment comes out of the margin, not the customer’s pocket. That brings contribution to $19.52 per order.
| Item | Value |
|---|---|
| MSRP | $29.97 |
| Scale wholesale (COGS) | $8.45 |
| Unit margin | $21.52 (71.8%) |
| Fulfillment | $2.00/item |
| Contribution per order | $19.52 |
Platform and payment processing fees are not modeled here. Subtract them from the $19.52 to get true contribution.
Now run the 3:1 rule backward. Contribution is the lifetime value side of the ratio, and the question flips: how much can you afford to spend to acquire this customer? The answer is not a guess. It is a direct function of how many times that customer orders from you.
The affordable CAC ladder
| Orders | Contribution LTV | Max CAC at 3:1 |
|---|---|---|
| 1 order | $19.52 | $6.51 |
| 3 orders | $58.56 | $19.52 |
| 6 orders | $117.12 | $39.04 |
| 12 orders | $234.24 | $78.08 |
That ladder is the whole point. Your reorder rate sets your affordable CAC, not the other way around. A one-and-done buyer caps your spend at $6.51; a customer who orders 3 times lets you spend $19.52. Six orders push the ceiling to $39.04, and twelve take it to $78.08.
Where the $89 benchmark lands
Ecommerce CAC benchmarks sit around $89 per customer, per Ringly (June 3, 2026). A single-purchase brand trying to compete at that number runs far below 1:1. It loses money on every customer it acquires.
Even the 12-order customer on this ladder produces $234.24 in contribution. Against an $89 CAC, that is not a 3:1 payback. The ladder caps out before the benchmark becomes affordable. That gap is why so many supplement brands spend themselves into a corner: they set CAC against a one-time purchase instead of against a customer lifetime.
This is why the reorder engine matters more than the ads. You can’t outbid your way to a profitable CAC. You can only raise LTV by pulling more orders out of each customer.
All of this math runs on Scale plan wholesale. The Free plan still gives you on-demand dropship with the same flat $2 per item fulfillment, but per-unit cost runs higher, which shrinks contribution and pulls every rung of the ladder down. Run your own product through the supplement margin calculator to see where your ceiling sits.
If you want the Scale pricing that makes the math above work, check Rocktomic membership pricing. And for more on how per-bottle numbers stack up across fulfillment models, read the per-bottle unit economics for dropship supplements breakdown.
Why Do Supplement Brands Need Reorders to Hit 3:1?
Because you cannot buy the same customer twice and still win. Paying for acquisition on every single transaction destroys your ratio. Reorders are the only way to spread one CAC across multiple revenue events.
Supplements are the strongest retention category in ecommerce. Repurchase rates hit 37.7% within 24 months, the highest of any consumer category, per Commerce Catalyst (May 25, 2026). A 90-day subscription generates about 4x the annual purchases of a one-time buyer (Commerce Catalyst, May 25, 2026). That is the difference between one revenue event and four. It is also the difference between a 1:1 LTV to CAC ratio and a healthy 3:1.
Retention is a profit lever, not a revenue line
Research from Bain & Company and Harvard Business School, cited in Ringly (June 3, 2026), found that a 5% improvement in retention lifts profits 25% to 95%. Small retention gains move profit more than almost any pricing change you can make.
Retention also has to be affordable. Healthy DTC payback is 90 to 120 days (Ringly, June 3, 2026). If gross margin per order is thin, one sale cannot carry that payback window. Reorders are what make the math work.
Subscription structure changes the math
Month-to-month supplement subscriptions churn 5% to 8% monthly. Annual billing cuts effective monthly churn by 60% to 80% (Eightx, July 1, 2026). The billing model is a retention lever you control before a single ad dollar is spent. Longer terms mean more order events per customer, which means more contribution per acquisition dollar.
This connects to the LTV ladder from Part 6. Each reorder multiplies contribution LTV, which raises the ceiling on what you can afford to pay for a new customer. Once you know what a repeat buyer is worth, your LTV math for multivitamin subscriptions becomes the reference point for every offer you build. Compare that repeat buyer value against your cost per acquisition, and the 3:1 target becomes a measurement problem, not a hope.
One-time buyers keep your dashboard green for a month. Reorders keep the brand alive for years. Structure the offer around the second purchase from day one.
How to Improve Your LTV to CAC Ratio
Raising LTV is the lever you control. Cutting CAC has a ceiling. Here are six tactics that move the numerator, each one tested against the ROC943 economics from Part 6. Every one of them assumes the customer comes back.
- Default to subscribe, with escape hatches. Make subscription the preselected option at checkout, then hand customers skip, pause, and swap controls from day one. Flexibility cuts first-cycle cancels, and failed-payment churn can account for 20% to 40% of subscription losses, per Ringly (June 3, 2026). Rocktomic’s store integrations for subscriptions and reorders keep that billing loop running without manual work.
- Bill annually, not monthly. Annual or multi-month billing removes most monthly cancel decisions. A customer who commits for a year makes one choice, not twelve. Part 7 covered the effective-churn reduction; the short version is that fewer billing events mean fewer chances to lose the customer. At the ROC943 price point, keeping one cycle is worth more than chasing one new lead.
- Raise AOV without raising CAC. Bundles and free-shipping thresholds push order size up. Pair a bestseller with a high-margin SKU and the average order value climbs. That extra revenue lands straight in LTV, and it costs nothing more to acquire.
- Time reorder emails to the consumption window. For a 30-day supply, send the reminder around day 25 to 28, before the customer runs out and drifts. Most brands sell the first bottle and go silent. Follow with a win-back sequence for anyone who lapses. The reorder is where the ROC943 math turns profitable.
- Turn buyers into referrers. A referral offer that rewards both sides converts satisfied customers into a low-CAC acquisition channel. A customer who refers is also a customer who believes, which is exactly the signal you want. Referred customers also tend to stick around longer, which lifts the ratio from both ends.
- Sell a second SKU post-purchase. Upsell or cross-sell a second product right after checkout. A customer with two products has more reasons to reorder, and orders per customer climb. That is LTV growth no acquisition spend can match.
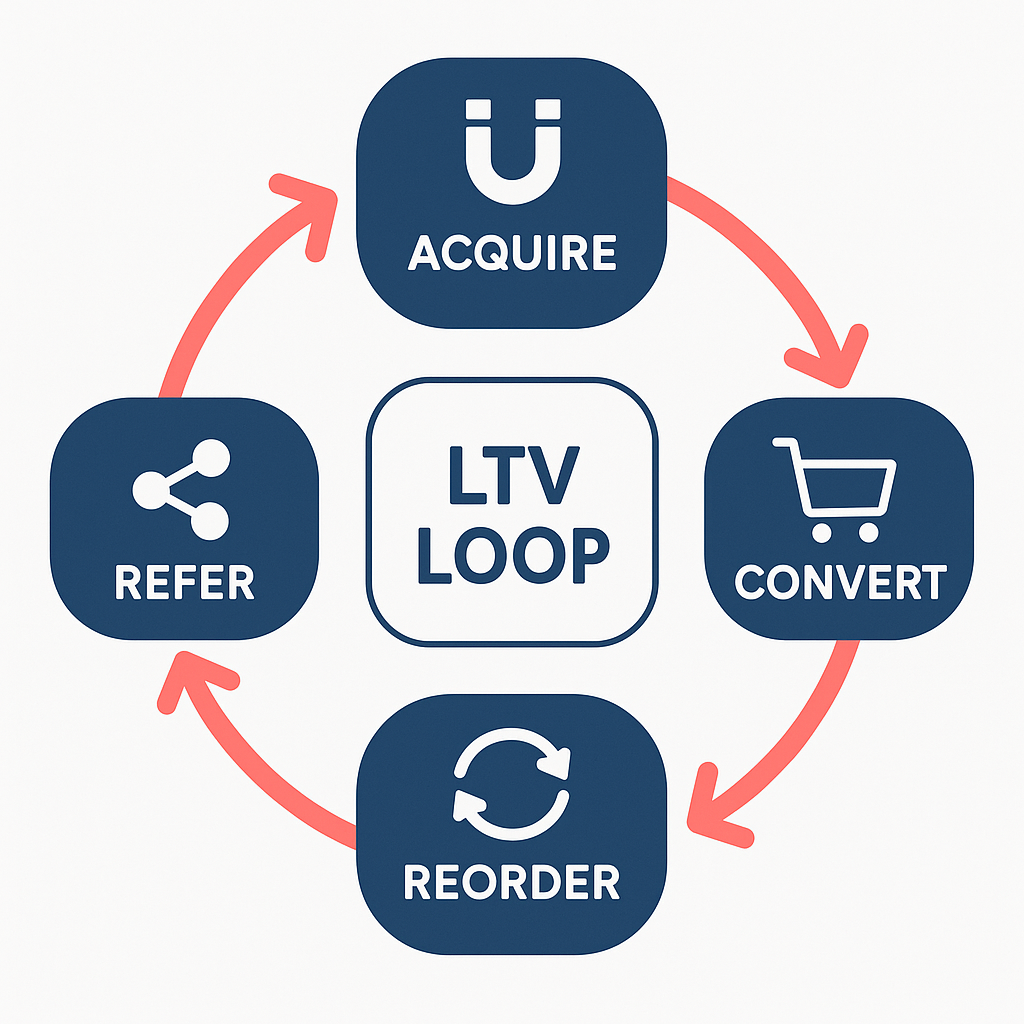
The operator’s rule: raising LTV compounds over the customer lifetime, while cutting CAC saves money exactly once. That is the whole argument for retention. Build the retention loop first, then spend on acquisition. How Rocktomic on-demand fulfillment works takes the inventory risk off the table so the loop stays your only job.
Common Mistakes That Distort Your LTV to CAC Ratio
A wrong LTV to CAC ratio is worse than no ratio at all. It tells you to scale ad spend when the underlying math is broken. Four traps distort the number most often, and each has a diagnostic question you can run against your own dashboard today.
Trap 1: Building LTV on revenue instead of contribution
Revenue counts every dollar a customer pays you. Contribution counts what you actually keep after product cost, fulfillment, and transaction fees. On thin supplement margins, that gap is large. Counting revenue instead of contribution can overstate the ratio by 1.5x to 3x.
Ask yourself: is my LTV built on revenue or contribution?
Trap 2: Relying on blended CAC
Blended acquisition cost averages every channel into one number, and that hides the losers. A business average of 4:1 can hide one channel running at 1.5:1. The average looks healthy while that channel burns cash every day.
Ask yourself: what is each channel’s CAC on its own?
Trap 3: Ignoring the payback period
A great ratio can still starve your business of cash. If contribution takes 18 months to recover CAC, you fund a year and a half of spend before a dollar comes back. Cash flow breaks long before the ratio does.
Ask yourself: how long until contribution recovers CAC?
Trap 4: Averaging across cohorts and SKUs
A new-product cohort and a mature subscription cohort are different businesses. Mix a launch SKU with an established bestseller and the average means nothing. The same applies to customers acquired in different quarters at different ad costs. Measure them separately or the ratio lies.
Ask yourself: am I averaging different cohorts or SKUs together?
Run all four questions before you scale spend. Fixing a distorted ratio is far cheaper than funding one.
Frequently Asked Questions
What is the LTV to CAC ratio?
The LTV to CAC ratio divides a customer’s lifetime value (LTV) by the customer acquisition cost (CAC). It shows how many dollars a brand earns from a customer for every dollar spent acquiring them. A ratio of 3:1 means each customer returns three dollars of lifetime value for every one dollar of acquisition spend. For supplement brands, the ratio combines repeat purchase math with ad spend efficiency, which makes it the clearest signal of whether scaling will be profitable.
Why is the 3:1 LTV to CAC ratio the ecommerce benchmark?
Shopify (2026) guidance treats 3:1 as the minimum healthy ratio for ecommerce: three dollars of lifetime value for every dollar of acquisition cost. Below 2:1, brands typically lose money once COGS, fulfillment, and overhead are included. Above 5:1 usually signals under-investment in growth. For brands scaling aggressively, 4:1 is ideal because it leaves room for rising ad costs. The 3:1 floor is the benchmark most operators and investors use when judging a business.
How do you calculate LTV for a supplement brand?
LTV equals average order value times purchase frequency per year times average customer lifespan in years, multiplied by the contribution margin percentage. Contribution margin means revenue minus COGS, fulfillment, and transaction costs, not raw revenue. A brand selling a $29.97 product with a $21.52 unit margin and a flat $2 fulfillment fee keeps about $19.52 per order; three orders make a contribution LTV near $58.56. Cohort analysis gives a more accurate number than blended averages.
How do you calculate CAC for a supplement brand?
CAC equals total acquisition spend divided by the number of new customers acquired in the same period. Fully-loaded CAC includes ad spend, creative production, tools, agency fees, and the salary time spent on acquisition, not just the ad platform’s reported number. Blended CAC divides all spend by all new customers, while channel CAC isolates one source such as TikTok or Google. Brands should track both: blended for overall health, channel-level for budget decisions.
What is a healthy CAC payback period for a supplement brand?
The payback period is how long it takes for a customer’s contribution to recover the CAC. For direct-to-consumer brands, 90 to 120 days is the typical healthy range per Ringly (June 2026). Under six months is ideal; beyond twelve months is risky unless retention data is strong. Because ad costs keep rising, a short payback period protects cash flow. Brands that sell bundles or subscriptions tend to see faster payback than single-purchase brands.
What CAC can a supplement brand actually afford?
Divide the contribution LTV by 3 to find the affordable CAC at the 3:1 benchmark. Using a real Scale-plan example, Super Creatine Gummies (ROC943) has an MSRP of $29.97, a Scale wholesale of $8.45, and a $21.52 unit margin. After the flat $2 per item fulfillment fee, contribution is about $19.52 per order. One purchase supports a CAC near $6.51; three purchases support $19.52; twelve support about $78. This is why reorder rate decides how much a brand can pay for traffic.
How does a subscription model change the LTV to CAC ratio?
Subscriptions raise purchase frequency, which lifts LTV without changing CAC, so the ratio improves immediately. A monthly subscription at the same $19.52 contribution per order reaches $58.56 of LTV in three months and $234 in twelve, allowing a CAC near $78 at the 3:1 line. On the Rocktomic Scale plan at $297 per month, brands get the full catalog at the lowest per-unit wholesale, which widens the margin that feeds LTV. Fulfillment stays flat at about $2 per item.
What is the fastest way to improve a supplement brand’s LTV to CAC ratio?
Fix the first-to-second purchase rate before touching ad spend. If customers are not reordering, that is the highest-leverage problem, and it compounds across the whole customer lifetime. Tactics that work: subscriptions, bundles that raise average order value, email reorder flows, and referral offers for existing buyers. Cutting CAC by slashing spend often brings in worse customers, while raising LTV compounds over every future order. The Rocktomic Free plan at $0 per month with a flat $2 per item fee lets brands test this math before scaling.
Run Your Own Numbers and Compare Plans
Run your own SKU through the supplement margin calculator to find your contribution per order. Divide that number by three, and you have your affordable CAC. Then compare plans: the Free plan at $0 per month is built for testing, while the Scale plan at $297 per month includes the lowest per-unit wholesale that widens the margin feeding your ratio.
If you want a second opinion, book a call with Rocktomic, or start with the Rocktomic vs Supliful comparison.
Last updated: June 21, 2026